
Page 55 - InvestmentGuideBrasilEng
P. 55
GENERAL MARKET
INFORMATION
Brazil has become the 7th-largest vehicle produc- In the next four years these resources will SECTOR GDP ENGINEERING AND DESIGN
er and the 4th-largest vehicle consumer market be used in expanding production, engineering In 2012, The Brazilian Automotive complex was re-
in the world. Since 2006, vehicle production in and new products. The automotive sector in sponsible for 18.7% of the Brazilian industrial GDP, Brazil is a global platform for compact and compact
Brazil has been over 2 million units a year and has Brazil brings together the leading global brands with total net revenue of US$93.977 billion. premium vehicle development and production.
been growing uninterruptedly (3.3 million units in in automobiles, light commercial vehicles, bus- GM has a dedicated engineering and design team
2012). The automotive industry in Brazil accounts es, trucks and agricultural machinery. The 25 in Sao Caetano do Sul, Sao Paulo, as part of a glob-
for almost 20% of the country’s GDP. manufacturers that make up the Brazilian auto- al design network that integrates Korean, Chinese
The recent crisis that affected automo- motive industry are: AGCO (Massey Ferguson), and US offices. Fiat has only two design centers in
tive markets in other parts of the world was Agrale, Caterpillar, CNH (Case e New Holland), the world: Italy and Brazil. There is an engineering
well-managed in Brazil. The Federal Government Fiat, Ford, General Motors, Honda, Hyundai, In- center with more than 1,500 engineers in the city
implemented a range of measures to assure eco- ternational, Iveco, John Deere, Karmann-Ghia, of Betim, Minas Gerais. Ford and VW have their
nomic growth through increased production and Komatsu, Man (Volkswagen Caminhoes e Oni- design and engineering teams in Brazil engaged in
consumption. Among the measures were interest bus), Mercedes-Benz, Mitsubishi, Nissan, Peu- developing vehicles for emerging markets.
rate cuts, extended credit, excise tax reductions geot Citroen, Renault, Scania, Toyota, Valtra,
and programs to encourage the acquisition of Volkswagen and Volvo.
trucks and buses. The industry also has sales infrastructure NET SALES AND SHARE
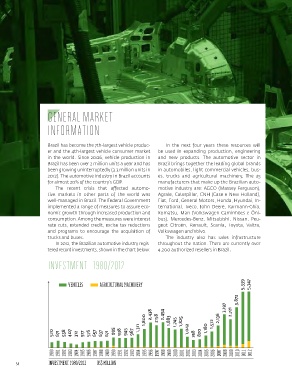
In 2012, the Brazilian automotive industry regis- throughout the nation. There are currently over
tered record investments, shown in the chart below: 4,200 authorized resellers in Brazil. IN INDUSTRIAL GDP - 1966/2012
INVESTMENT - 1980/2012
VEHICLES AGRICULTURAL MACHINERY SHARE IN INDUSTRIAL GDP %
VEHICLES AGRICULTURAL MACHINERY 5,339 5,347 100 25%
90 20.6% 18.7% 19.2% 18.9% 18.7%
3,872 80 13.0% 14.6% 13.3% 14.3% 13.8% 14.6% 14.8% 13.9% 14.7% 14.8% 14.6% 14.6% 15.1% 17.3% 17.8% 20%
70
3,197 2,721 60 10.6% 10.8% 13.1% 12.6% 13.0% 13.5% 12.9% 12.5% 15%
50
1,800 2,438 2158 2,454 1,883 1,745 1,825 1,572 2,136 40 10%
30
20
5%
520 671 558 407 312 517 576 657 637 671 995 938 945 967 1,311 1,042 748 820 1,180 10 0 0%
1966 1970 1975 1980 1985 1990 1991 1992 1993 1994 1995 1996 1997 1998 1999 2000 2001 2002 2003 2004 2005 2006 2007 2008 2009 2010 2011 2012
1980 1981 1982 1983 1984 1985 1986 1987 1988 1989 1990 1991 1992 1993 1994 1995 1996 1997 1998 1999 2000 2001 2002 2003 2004 2005 2006 2007 2008 2009 2010 2011 2012 NET SALES AND SHARE IN INDUSTRIAL GDP 1966/2012 US$ BILLION
54 INVESTMENT 1980/2012 US$ MILLION 55