
Page 39 - InvestmentGuideBrasilEng
P. 39
B R A Z I L I N NU MBE R S ? Brazil’s exports ? Main exports in 2012: ? Main imports in 2012:
FOREIGN TRADE
» Commodities: 46.8%
N
GOOD
1 O GOOD % SHARE N 1 O Oil and fuel % SHARE
13.7
Ores
18.0
» Manufactured goods: 37.4%
2 Oil and fuel 12.8 2 Mechanical equipment 15.5
» Partly manufactured goods: 13.6% 3 Soybeans and derivative products 3.8 3 Electrical and electronic equipment 11.4
4 Transportation material 10.1 4 Motor vehicles and parts 9.5
» Special operations: 2.2%
5 Metallurgic products 6.4 5 Organic and inorganic chemicals 5.6
? Brazil’s imports 6 Chemicals 6.3 6 Fertilizers 3.8
7 Meat products 6.3 7 Plastics and derivative products 3.6
» Intermediate goods: 44.7% 8 Sugar and ethanol 6.2 8 Iron, steel and derivative products 3.4
» Capital goods: 21.8% 9 Machinery and equipment 4.4 9 Pharmaceuticals 3.1
10 Paper and pulp 2.7 10 Optical and precision equipment 2.9
» Consumer goods: 17.6% 11 Coffee 2.7 11 Rubber and derivative products 2.0
12 Electrical equipment 1.9
» Oil and fuel: 15.8% 12 Cereals and milling products 1.3
13 Tobacco and derivative products 1.3 13 Copper and its products 1.2
14 Footwear and leather goods 1.4 14 Synthetic and artificial filaments/fibers 1.1
15 Textiles 1.4
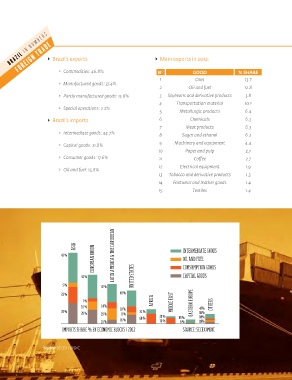
ASIA INTERMEDIATE GOODS
EUROPEAN UNION OIL AND FUEL LATIN AMERICA & THE CARIBBEAN SEMIMANUFACTURED
43 % LATIN AMERICA & THE CARIBBEAN MANUFACTURED
COMSUMPTION GOODS
43 % UNITED STATES CAPITAL GOODS ASIA EUROPEAN UNION BASICS
5 % 47 % 11 %
15 %
23 % 48 % 80 % 36 % UNITED STATES
7 % AFRICA MIDDLE EAST EASTERN EUROPE
16 % 14 % 47% OTHERS 14 % 51 % MIDDLE EAST EASTERN EUROPE
29 % 29 % 29 % 18 % 31 % 21 % 16% 74 % 4 % 19 % 20 % AFRICA 38 % 17 % 41 % OTHERS
8 %
28 %
15 %
63 %
31 %
19%
8 %
10 % 26 % 68 % 76 % 89 % 18% 16 % 50 % 30 % 65 % 36 % 20 % 28 %
IMPORTS SHARE % BY ECONOMIC BLOCKS / 2012 SOURCE: SECEX/MDIC EXPORTS SHARE % BY ECONOMIC BLOCKS / 2012 SOURCE: SECEX/MDIC
Source: SECEX / MDIC
Source: SECEX / MDIC
38 39