
Page 32 - InvestmentGuideBrasilEng
P. 32
CHALLENGES AND LATEST ECONOMIC DATA DYNAMIC ECONOMY
OPPORTUNITIES IN THE For the latest economic indicators, the Brazilian
Central Bank provides monthly charts in English.
NEW BRAZIL For the most recent edition, please click on the
following link: http://www4.bcb.gov.br/pec/gci/
ingl/Economic_Chart_Pack.pdf WITH A LARGE
There is still much to be done to ensure that the
economy continues to grow in the years ahead.
Brazil is not isolated from the global economy and
in recent years turbulent headwinds from the Euro- DOMESTIC MARKET
pean sovereign debt and banking crisis have caused
Brazil’s growth to decrease to more moderate rates.
Yet Brazil remains a compelling opportunity
for international investors seeking to create a new
business venture or expand their international Brazil’s prospects have never been better. Brazil is
operations. Local demand remains robust, unem- a market of superlatives, from being the world’s
ployment rates remain at historical lows and FDI top producer and exporter of major food and
inflows are at record highs. resource commodities to leading market growth as a result of wage growth and record low unem-
At the same time, not all of Brazil’s challeng- and share in consumer retail. But much has yet to ployment rates. Upward social mobility, shown by
es come from abroad. Important reforms are be achieved. Major investments are planned in the an increase in the emerging middle class, is creat-
being carried out to address internal growth infrastructure and energy sectors. ing a huge demand for consumer products. Brazil’s
constraints. These internal challenges are in demographic profile is a further positive charac-
themselves a source of opportunity for interna- teristic, as the vast majority of the population falls
tional investors, such as the government’s recent within the economically active range.
decision to open Brazil’s infrastructure assets to Historical trends of personal disposable in-
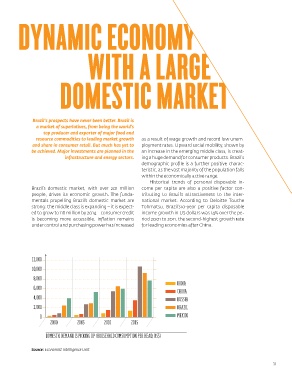
private investment. The whole economy stands Brazil’s domestic market, with over 201 million come per capita are also a positive factor con-
to benefit from a more efficient, modern and en- people, drives its economic growth. The funda- tributing to Brazil’s attractiveness to the inter-
hanced infrastructure network as a result of this mentals propelling Brazil’s domestic market are national market. According to Deloitte Touche
ambitious program, which will reduce costs for strong: the middle class is expanding – it is expect- Tohmatsu, Brazil’s10-year per capita disposable
doing business and generate further investment. ed to grow to 118 million by 2014 – consumer credit income growth in US dollars was 14% over the pe-
One of the main challenges facing the Bra- is becoming more accessible, inflation remains riod 2001 to 2011, the second-highest growth rate
zilian economy is increasing its investment rate. under control and purchasing power has increased for leading economies after China.
From 2008 it has reached new heights, which
have fluctuated between 18% and 20% of GDP. The
goal of the Government is to increase gross fixed
capital formation even further in order to ensure
sustainability and accelerate economic growth.
12,000
10,000
65 8,000
60 6,000 INDIA
55 4,000 CHINA
RUSSIA
50 2,000 BRAZIL
45 MEXICO
40 0 2000 2005 2010 2015
35
10 DOMESTIC DEMAND IS PICKING UP HOUSEHOLD COMSUMPTION PER HEAD; US$
2002 2003 2004 2005 2006 2007 2008 2009 2010 2011 2012
Source: Brazilian Central Bank, Ministry of Finance Source: Economist Intelligence Unit
CONSOLIDATED PUBLIC SECTOR NET DEBT, AS % OF GDP
30 31